Drone survey
A survey area over farmland on the satellite map. The flight path runs in lanes across the area, the flown part is yellow and the drone is a flat marker heading along its lane.
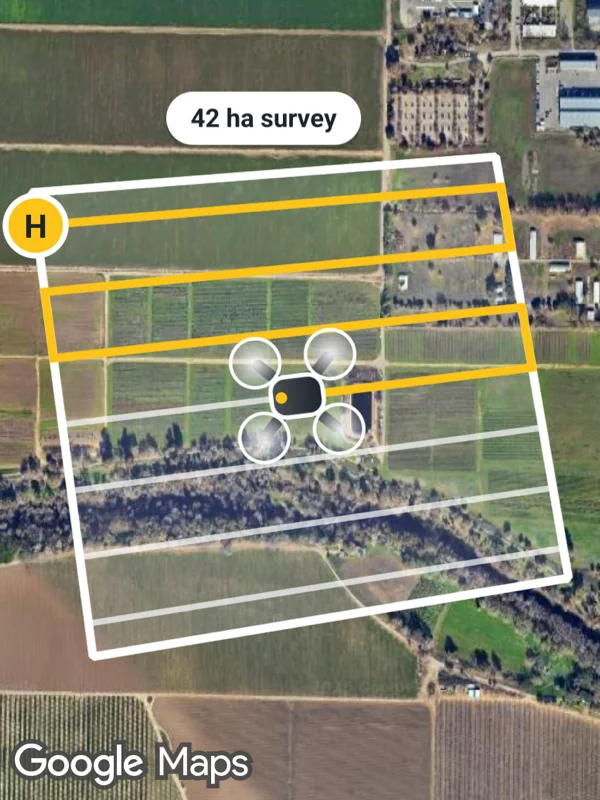
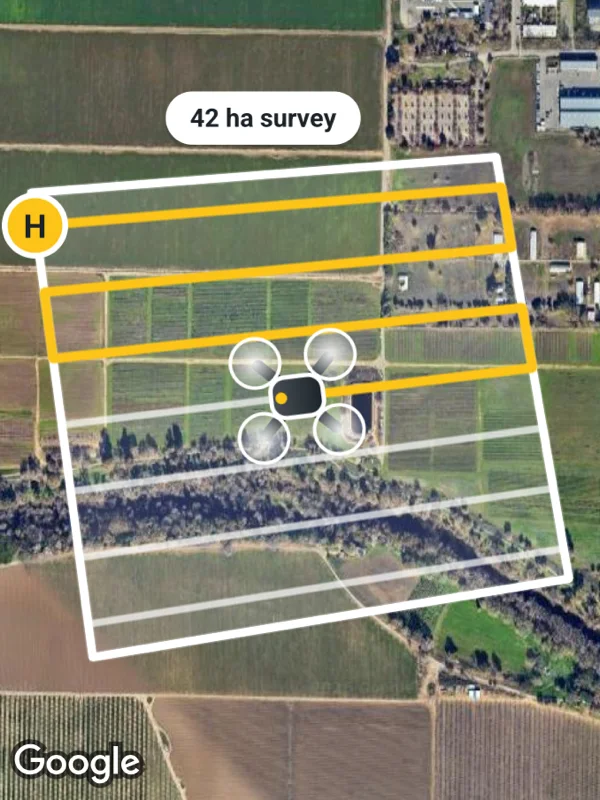
Uses mapType, polygons, polylines, markers.
drone.tsx
import React from 'react';

import { GoogleMapsView, type RNLatLng } from 'react-native-google-maps-plus';

import { ABOVE, BOLD, INK, Z, bearing, label, ll, marker, svg } from './shared';

const area = [
  ll(38.5316, -121.8018),
  ll(38.5321, -121.7935),
  ll(38.5262, -121.7922),
  ll(38.5251, -121.8007),
];

const lerp = (a: RNLatLng, b: RNLatLng, f: number) =>
  ll(
    a.latitude + (b.latitude - a.latitude) * f,
    a.longitude + (b.longitude - a.longitude) * f
  );

// Back and forth lanes across a four cornered area.
function lanes(corners: RNLatLng[], count: number) {
  const [a, b, c, d] = corners as [RNLatLng, RNLatLng, RNLatLng, RNLatLng];
  return Array.from({ length: count }, (_, i) => {
    const f = (i + 0.5) / count;
    const left = lerp(a, d, f);
    const right = lerp(b, c, f);
    return i % 2 === 0 ? [left, right] : [right, left];
  }).flat();
}

const path = lanes(area, 7);
const drone = lerp(path[6]!, path[7]!, 0.5);

const droneIcon = svg(
  60,
  60,
  `<defs>
     <radialGradient id="rotor" cx="0.5" cy="0.5" r="0.5">
       <stop offset="0" stop-color="#ffffff" stop-opacity="0.9"/>
       <stop offset="1" stop-color="#ffffff" stop-opacity="0.15"/>
     </radialGradient>
     <linearGradient id="body" x1="0" y1="0" x2="0" y2="1">
       <stop offset="0" stop-color="#495057"/>
       <stop offset="1" stop-color="${INK}"/>
     </linearGradient>
   </defs>
   <g transform="scale(1.25)">
     <path d="M12 12 L36 36 M36 12 L12 36" stroke="${INK}" stroke-width="4" stroke-linecap="round"/>
     <circle cx="11" cy="11" r="8.5" fill="url(#rotor)" stroke="#ffffff" stroke-width="1.2"/>
     <circle cx="37" cy="11" r="8.5" fill="url(#rotor)" stroke="#ffffff" stroke-width="1.2"/>
     <circle cx="11" cy="37" r="8.5" fill="url(#rotor)" stroke="#ffffff" stroke-width="1.2"/>
     <circle cx="37" cy="37" r="8.5" fill="url(#rotor)" stroke="#ffffff" stroke-width="1.2"/>
     <rect x="17" y="15" width="14" height="18" rx="5" fill="url(#body)" stroke="#ffffff" stroke-width="1.5"/>
     <circle cx="24" cy="18.5" r="2" fill="#fcc419"/>
   </g>`
);

const homeIcon = svg(
  30,
  30,
  `<circle cx="15" cy="15" r="13" fill="#fcc419" stroke="#ffffff" stroke-width="2.5"/>
   <text x="15" y="15.5" text-anchor="middle" dominant-baseline="central" font-size="14" ${BOLD} fill="${INK}">H</text>`
);

export default function DroneSurvey() {
  return (
    <GoogleMapsView
      style={{ flex: 1 }}
      mapType="satellite"
      mapOptions={{ camera: { center: ll(38.5287, -121.797), zoom: 15.05 } }}
      polygons={[
        {
          id: 'area',
          coordinates: area,
          fillColor: 'rgba(255, 255, 255, 0.14)',
          strokeColor: '#ffffff',
          strokeWidth: 4,
        },
      ]}
      polylines={[
        {
          id: 'flown',
          coordinates: [...path.slice(0, 7), drone],
          color: '#fcc419',
          width: 4,
          zIndex: 2,
        },
        {
          id: 'planned',
          coordinates: [drone, ...path.slice(7)],
          color: 'rgba(255, 255, 255, 0.7)',
          width: 3,
          zIndex: 2,
        },
      ]}
      markers={[
        marker('home', path[0]!, homeIcon, { zIndex: Z.pin }),
        marker('drone', drone, droneIcon, {
          flat: true,
          rotation: bearing(path[6]!, path[7]!),
          zIndex: Z.selected,
        }),
        label(
          'area-size',
          lerp(area[0]!, area[1]!, 0.5),
          '42 ha survey',
          ABOVE,
          {
            size: 11,
          }
        ),
      ]}
    />
  );
}
Colors, map styles and the SVG helpers svg, marker and pill come from shared.ts. Marker text uses the Roboto fonts bundled with the example app, see fonts.